 Introduction
A friend asked about the potential to develop a set of ActionScript charts that looked good and would run on Mobile, specifically Android phones and iPhone. Apparently a client was asking, and he wanted to know the feasibility for re-use. We discussed the challenges with the existing Flex charts, specifically their lack of Flex 4 skinning abilities, but more importantly their lack of performance scalability.
Like many projects in 2010, it didn’t go anywhere, but I was curious. I had done some charting work in the past that stretched the Flash Player past it’s limit, and wondered if 2 years later I could do better for an environment that’s performance constrained like mobile devices are. Sadly, things in the Flash Player haven’t improved to make things any easier, nor perform better. Obviously, it’s worse on some of these slow mobile devices. That said, I still found some interesting things when playing around with 4 potential drawing strategies that I thought I’d share, with same baseline metrics and code you can use yourself.
Green Threading
It should be noted that the Flex charts do not utilize green threading. Thus, once you start pumping in significant amounts of data, say over 500 or more data points, you’ll start to notice a slow down. Sometimes, you’ll exceed default 15 seconds script timeout, forcing you to compile with a higher number to ensure you support a variety of devices. The issue here is that having your app “freeze” for even 5 seconds isn’t acceptable.
Enter green threading. It’s not perfect, but does give the Flash Player some CPU cycles to respond to other redraw events and user interactions not related to your chart drawing. Keep in mind, too, if your Flash Player is unresponsive, you can also lose network connections as well, even if they came back successfully.
Bottom line, using green threading in drawing routines allows users to still interact with your application and not having it appear as being locked up. Â You can more about rendering large amounts of data in Flash Player from my past blog entry on it as well as Andrew Trice’s Visualization Large Data Sets and Bitmap Based Charting & Real Data. Â This gist is, make a timer, if you’re for loop is taking longer than 100 milliseconds, pause a frame, and continue on next frame where you left off. Â Ghetto fab.
Point/Line Reduction
While some of these devices coming out have some insanely high resolutions and pixel density, the reality is you still cannot see all of the data points in a data intensive chart. There are apparently a variety of algorithms out there that help reduce the density of data that you have to draw depending upon your current zoom level. While in theory these algorithms should have a significant impact on Flash Player’s rendering capabilities, the sad truth is that the algorithms themselves end up taking more CPU time then they are worth, at least the two I’ve seen. Requiring me to loop through massive amounts of points fails to realize that “looping” and “massive” just don’t jive together in Flash Player. Flash Player is really good at drawing & rendering things, so perhaps I’m mistaken, but without true threading capabilities (no, async Shader doesn’t count), I fail to see to value.
The 3 Drawing Routines
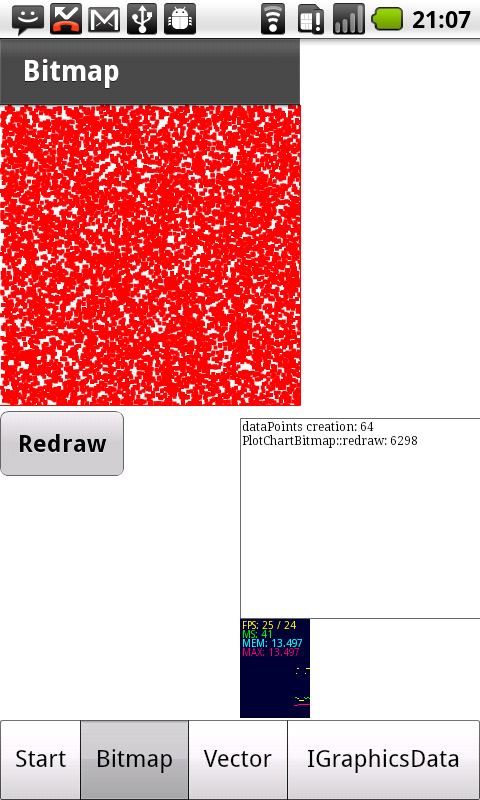
Combined with green threading, I’ve got 3 standard drawing routines, nothing fancy here (no multi-threaded Shader via PixelBender for example). These are used to draw a 4 pixel by 4 pixel red square on a white background. It’s just a simple spot chart. The goals are 1. I should be able to draw as many points as I want and 2. those points need to be accurately represented and 3. it should work on a mobile device. Using a Bitmap with setPixel/copyPixels didn’t work out because you can only draw on whole pixels, thus defeating visual accuracy; the more data points, the more inaccurate your drawing.
The following are the 3 drawing strategies I took:
- Copying a bunch of pixels together onto 1 Bitmap by moving a vector Shape around, and taking a picture of it’s current location, and copying that image on top of the former.
- Drawing a bunch of vector Shapes, and placing them where they should go.
- Drawing utilizing the new graphics data vector API.
Let’s talk about the pro’s and con’s of each.
1. BitmapData.draw
Pro’s: Fastest.
Con’s: Have to re-draw if you wish to zoom.
You create a bitmap the size of your chart, draw whatever represents a point in your chart in a vector Shape, and then every drawing iteration you position the Shape and do a bitmap.draw with alpha. The Nice thing about this algorithm is you only ever have 2 DisplayObjects; the Shape point and the Bitmap. Additionally, there is no penalty in continually adding pixels to the Bitmap; it’s the same bitmap with just different colored pixels. No additional RAM nor CPU once allocated.
The bad part is BitmapData.draw is slower than BitmapData.copyPixels, and whenever you wish to re-size your chart, you have to redraw it to ensure it looks good at the current resolution. The only thing you can object pool is the actual point data used to draw. Additionally, it becomes near impossible to redraw 1 particular point if 1 of your data points changes, thus you’re basically forced to redraw the entire thing.
2. Multiple Vector Shapes
Pro’s: Fast, visually scales, fast to redraw
Con’s: While sometimes as fast as Bitmap, the immense object allocation costs sometimes triggers garbage collection, slowing it down.
You create a Sprite, then create a new Shape per data point, and put that Shape into the Sprite. If you have 1000 data points, you’ll have 1000 Shapes. Shapes are one of the lowest RAM overheads in Flash Player, and are really fast and resource cheap to create. There clearly some optimizations going on because it’s often as fast, or faster than the BitmapData.draw method, even with that many DisplayObjects.
Another nice thing is you have a lot of options when scaling up or down. You can either Object pool the vector Shapes, and just re-position them when someone zooms out/in, or simply just adjust the scaleX/scaleY of the chart, and Flash Player will draw it for you. For data changes you can redraw just 1(x) individual points when their corresponding data points change, accessed through an uber-quick doubly linked list. This also allows a lot more control over custom designing points, but most importantly, interactivity with them (drill down, tooltips, etc). If you object pool the Shapes, it’s also pretty quick to redraw the entire thing.
The downside is you’re allocating a lot of resources quickly which will often trigger Garbage Collection inadvertently. Additionally, it sometimes has a higher RAM count than the BitmapData.draw routine because you have so many objects you’ve allocated.
3. Using IGraphicsData
Pro’s: Single vector Shape, low level & easier control of drawing (specifically Winding rules), visually scaleable, fastest drawing routine in the hundreds.
Con’s: Doesn’t scale in the thousands.
I was excited to hear we were getting lower level control over drawing routines.  If you’re doing complex charts, or redrawing a vector object multiple times, these things are great.  “Things” in this case being the drawing command classes that implement IGraphicsData.  You also get lower level control than you do with the Graphics methods.  For example, the winding rules allow you to draw multiple vector drawings over top of each other and they’ll just overlay vs. cut holes out like they do by default.  Cool stuff.
You basically just create a bunch of IGraphicsData drawing commands, pump ’em full of numbers of where to draw, and shove to a Graphics.drawGraphicsData method.
IGraphicsData seems to have a scalability problem in the thousands on the desktop and high hundreds on devices. Â It’s not a linear problem, but a harsh bell; once you get 4000+ data points, she chokes, but 500 or below, she’s uber fast, and wicked fast to redraw. Â I found it challenging to object pool that actual point numbers some of the IGraphicsData objects use.
Benchmark Times
On Desktop (in milliseconds):
3000 data points
- dataPoints creation: 9
- PlotChartBitmap::redraw: 253
- PlotChartVector::redraw: 198
- PlotChartGraphicsDataVector::redraw: 190
10,000 data points
- dataPoints creation: 29
- PlotChartBitmap::redraw: 739
- PlotChartVector::redraw: 774
- PlotChartGraphicsDataVector::redraw: 3791
On Nexus One
3000 data points
- dataPoints creation: 23
- PlotChartBitmap::redraw: 2 seconds
- PlotChartVector::redraw: 3 seconds
- PlotChartGraphicsDataVector::redraw: 13 seconds
10,000 data points
- dataPoints creation: 57 milliseconds
- PlotChartBitmap::redraw: 6 secs
- PlotChartVector::redraw:Â 16 secs
- PlotChartGraphicsDataVector::redraw 4 minutes
Additionally, the Bitmap chart takes the same amount of time to redraw. Â The Vector chart is about the same as well, even with object pooling the points (my example doesnt’ do a very good job). Â The IGraphicsData chart actually redraws the fastest (little good it does on a device), but this is only because no actually IGraphicsData object changed; if something did, I bet it’d continue to be slow as all get out.
Conclusions
IGraphicsData is a lot more flexible to draw with, but it just doesn’t scale, especially on slower processors like mobiles… or does it? You’ll notice that, at least on my 4 year old Macbook Pro, IGraphicsData is actually the fastest algorithm until you get above 4000 data points on the desktop, not sure on various devices.  Additionally, you can create 1 shape vs. many using the winding rules.  At smaller data point values, IGraphicsData uses the least RAM as well since you’re only creating 1 Shape, and a bunch of built-in ValueObjects.  Knowing this, the above can be mis-leading for charts below 1000 data points that require no interactivity.
For example, for 500 data points results in this on my phone:
- dataPoints creation: 10
- PlotChartBitmap::redraw: 432
- PlotChartVector::redraw: 398
- PlotChartGraphicsDataVector::redraw: 165
…but watch the redraw times:
- PlotChartBitmap::redraw: 311
- PlotChartVector::redraw: 351
- PlotChartGraphicsDataVector::redraw: 16
I modified the above example to randomize the 10th data point so 1 of the IGraphicsData points wouldn’t be the same. This ensures it does in fact redraw. Furthermore, my object pooling isn’t very good; I’m sure if I pooled the object points I’m pushing, maybe it could be even faster.
I bring this up because for a lot of financial charts which are often real-time, this is a huge deal.
From an interactivity perspective, which is what Flash Player excels at in charting, swapping out out the Vector chart’s Shapes with Sprites so you can add Mouse/Touch listeners/signals to them, the redraw is about the same. Â It’s still slower than using straight Shapes, and a little more memory.
The only really nice thing about the Bitmap option is that the RAM really doesn’t grow much, regardless of the size of your data points, and how many times you redraw. Â Where it breaks down is zooming in and out. Â Both Vector and IGraphicsData allow you to pool the Shapes/Sprites/data, with IGraphicsData being really quick about it.
Sadly, even with green threading you tend to lose a lot of frame rate while it draws. Â Lowering to 10 vs. 100 milliseconds seems to help a little bit.
Adobe, for the love of cheese, can we please get threading in Flash Player, kthx?!
SampleChartTypes (Flash Builder Library Project) – ZIP | FXPL
NOTE: I’ve only included the charts & VO with above code; my Flex code uses unstable SDK (heh). Â The following code should get you started; just take the points and shove ’em at a chart instance’s dataProvider property as an ArrayCollection:
service = new GetChartVOsService();
service.addEventListener("completed", onComplete);
service.getChartVOs(500);

function onComplete(event:Event):void
{
	yourChart.dataProvider = new ArrayCollection(service.chartVOs);
}
Comments
One response to “Basic Charting Drawing Routines for Flash & Flex Mobile Development”
Great article! We’re getting ready to re-create all the charts in Dedoose to move away from Axiis. Although Axiis is wonderful at getting highly customized data visualizations up and running quickly, it just was not built for performance in any way. If we’re going to the trouble to recreate the charting framework, we might as well do it right. Thanks again!